Introduction
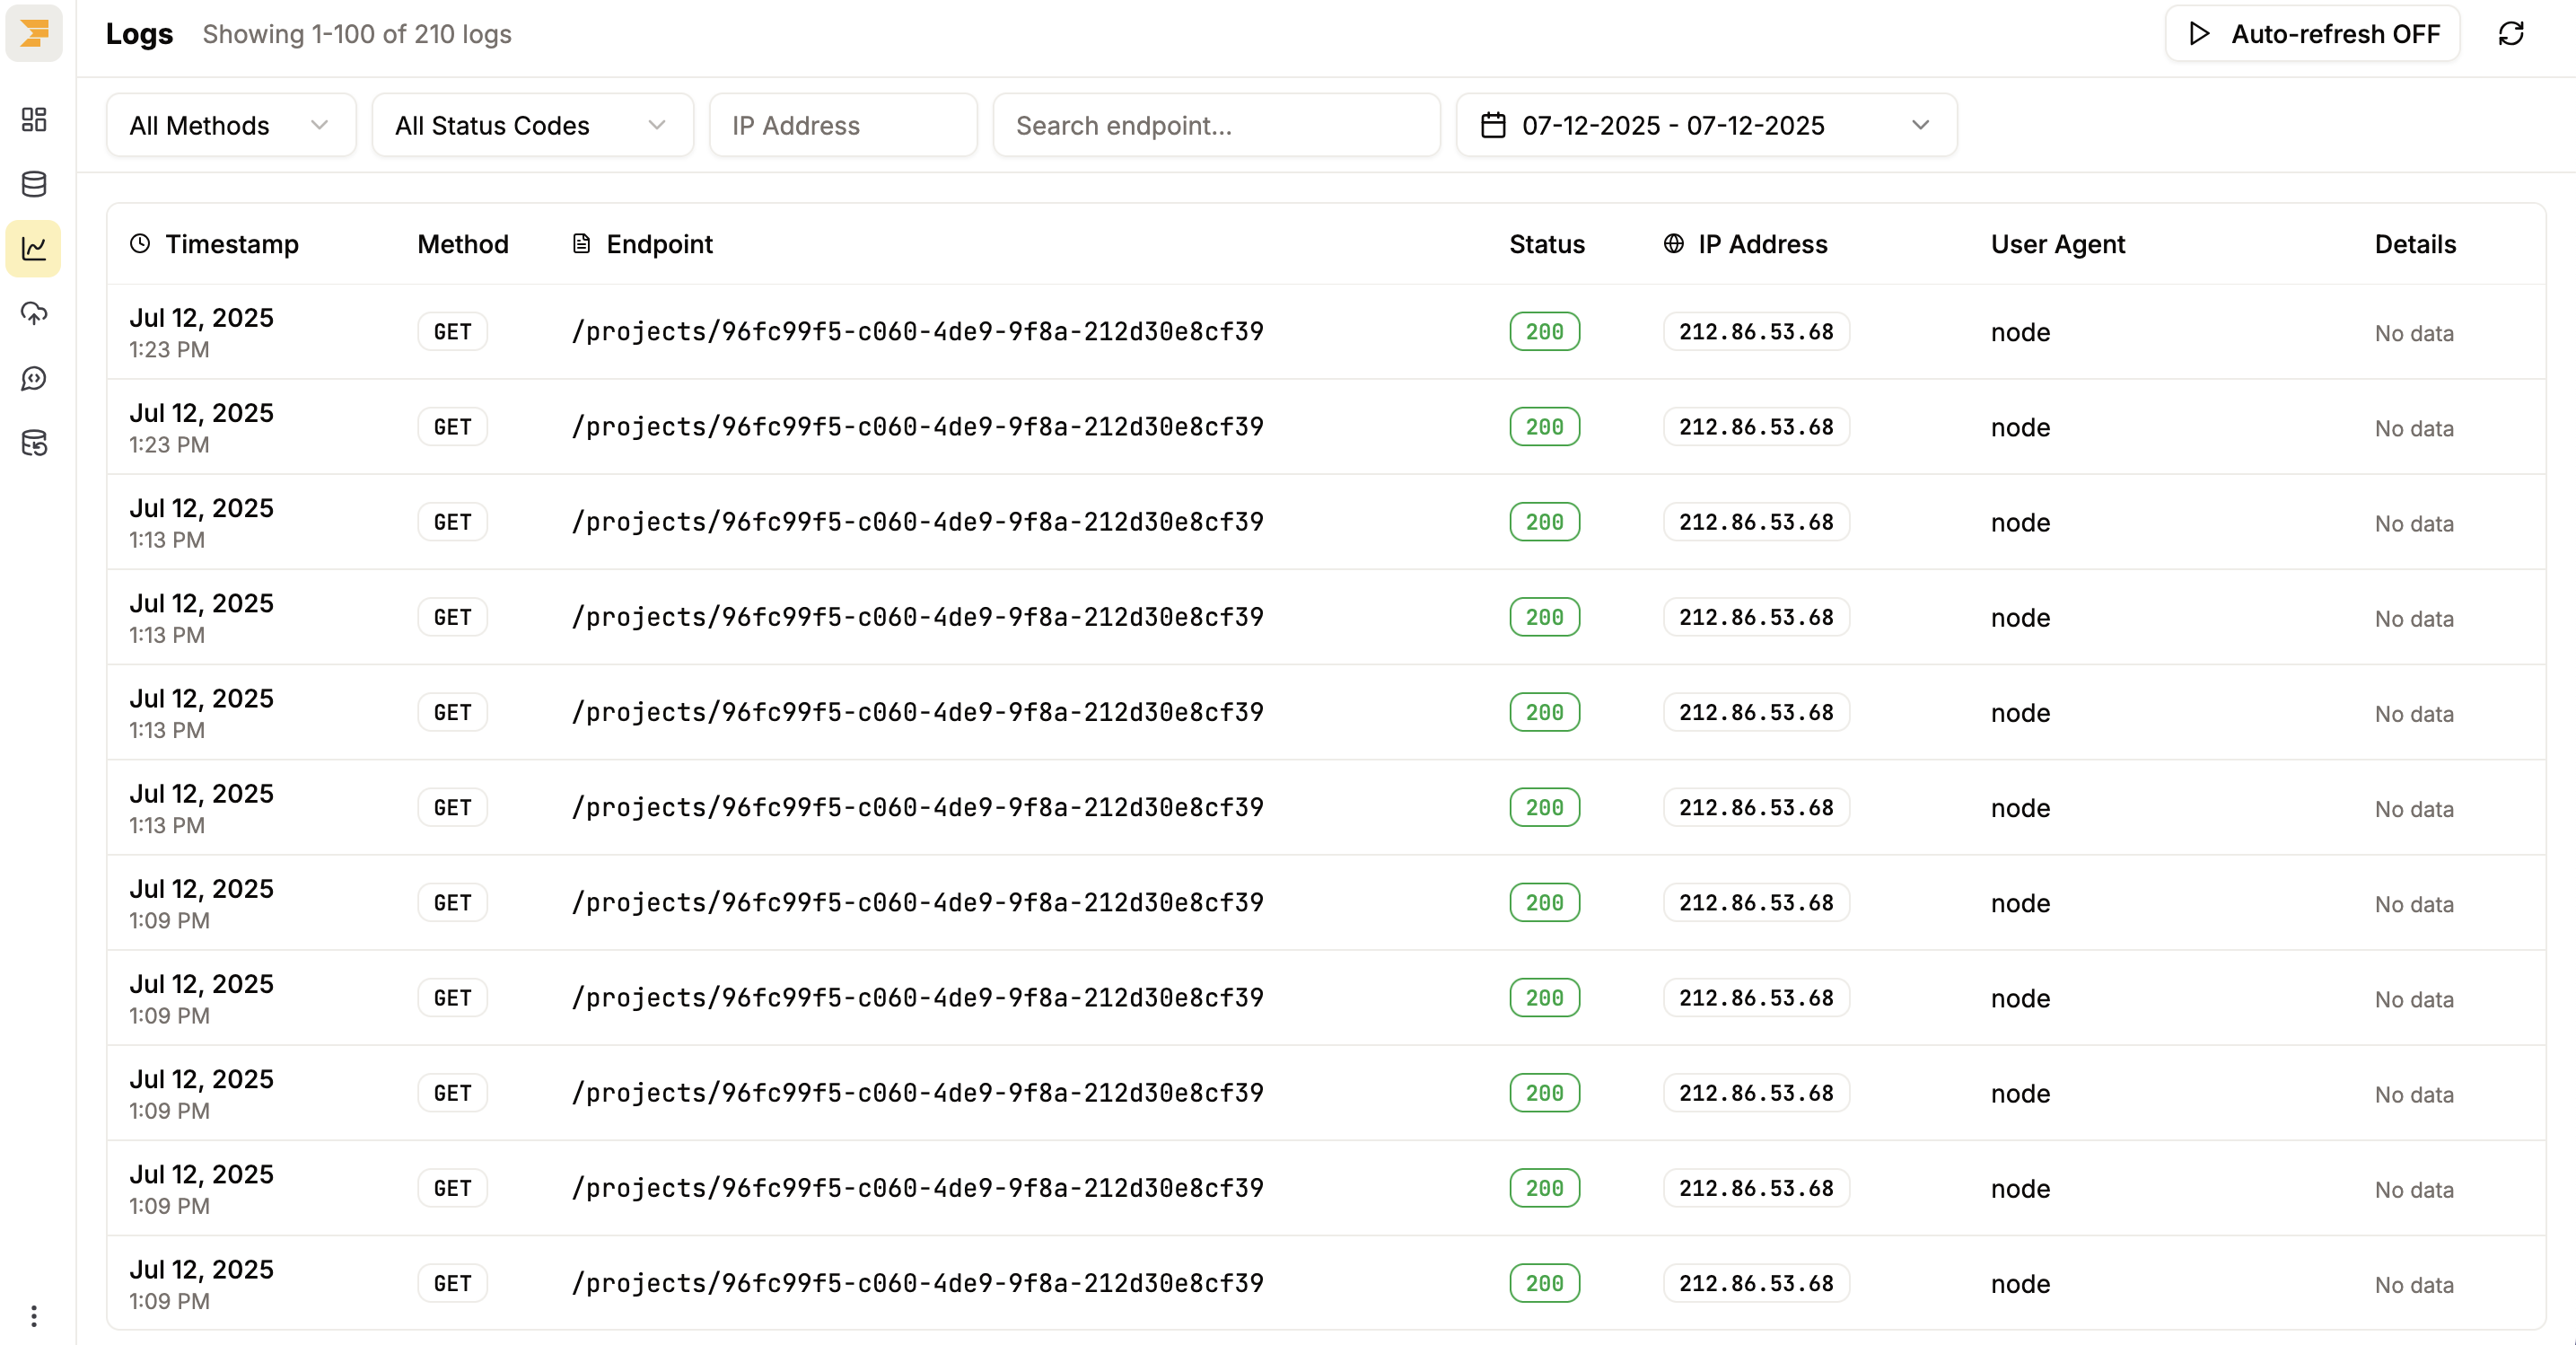
Filters
Filter by Method
Narrow down logs by specific HTTP methods. This is useful when you want to focus only on data reads, updates, or deletions. Supported methods include:- GET
- PUT
- POST
- PATCH
- DELETE
Filter by Status
Filter requests based on their status codes to quickly identify failed requests, unauthorised attempts, or successful operations. Supported status codes include:- 200: OK
- 201: Created
- 204: No Content
- 400: Bad Request
- 401: Unauthorized
- 403: Forbidden
- 404: Not Found
- 422: Unprocessable Entity
- 500: Internal Server Error
- 502: Bad Gateway
- 503: Service Unavailable
Filter by IP
View logs for requests coming from a specific IP address. Ideal for debugging client-specific issues or analysing usage patterns.Filter by Endpoint
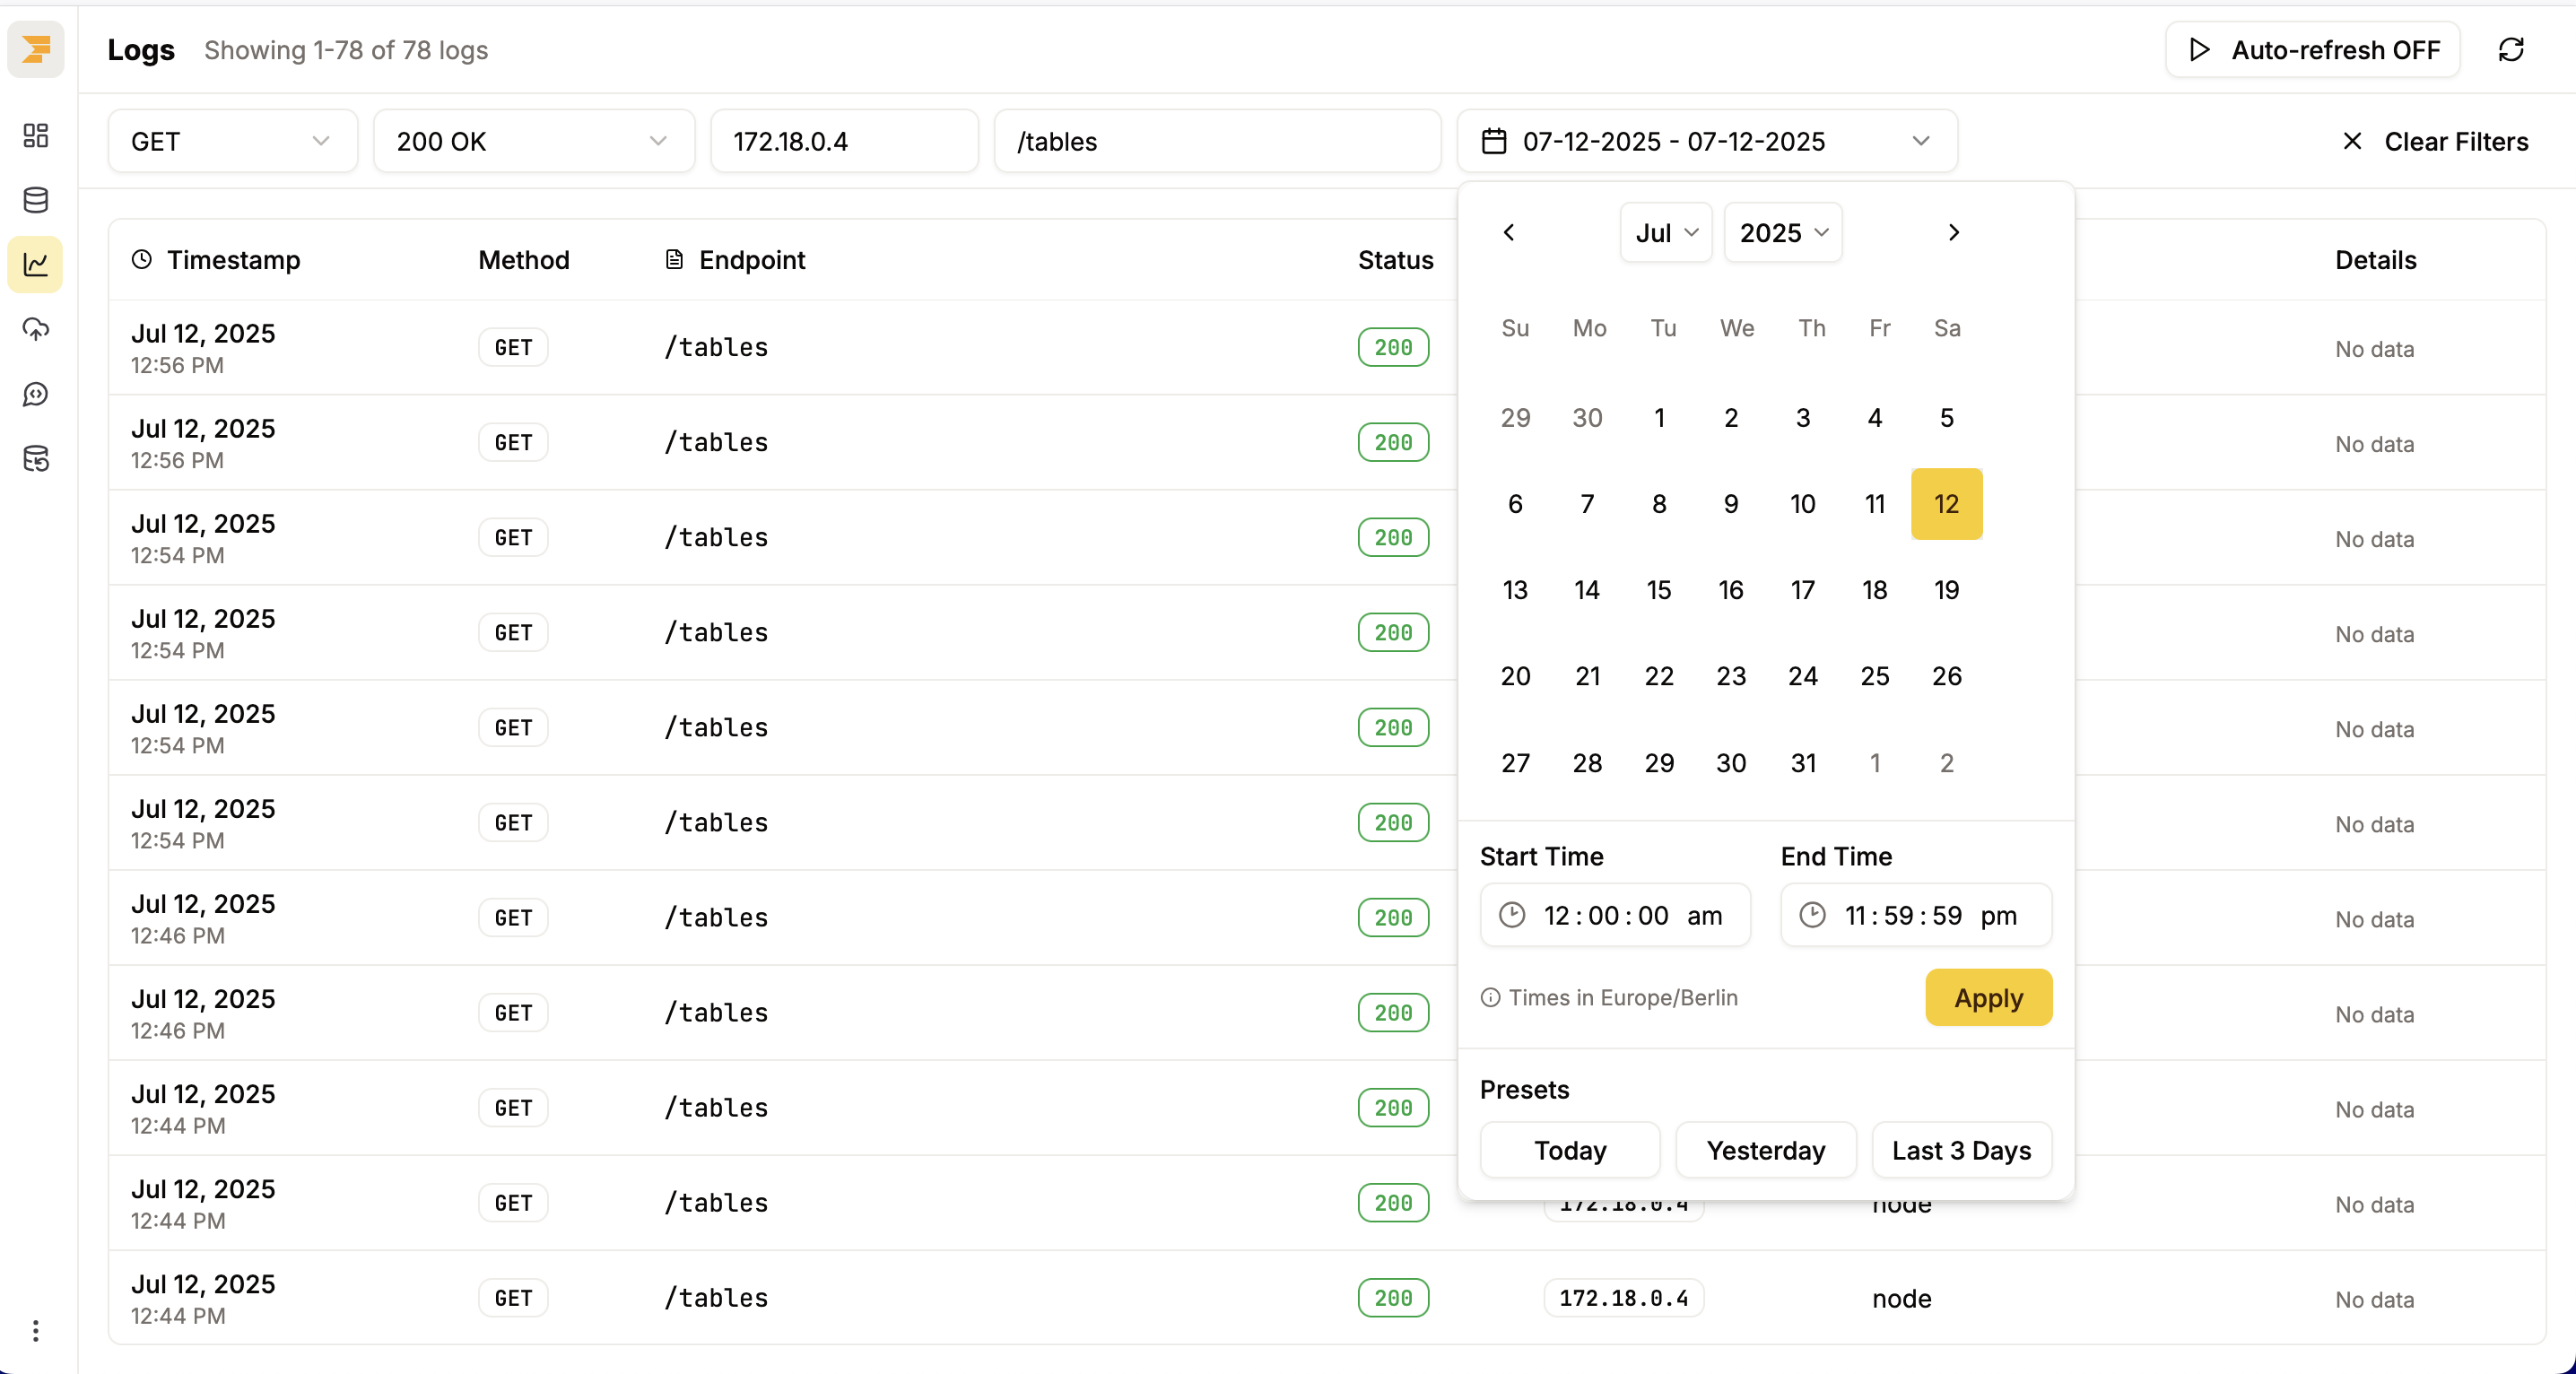
Limit your search to a specific endpoint to see all requests hitting that route. Useful for monitoring new features or troubleshooting specific resources.Filter by Date Range
Filter logs by date and time using a custom start and end time, or choose from convenient presets like:- Today
- Yesterday
- Last 3 Days
Details
You can click on any row, which will open the details drawer. You can find more insights about a given log and also copy values as needed.
Other
Copy
Many fields likeendpoint and IP Adress are copyable. Hover over them and you’ll see copy icon.